In the world of production and measurement no two structures or components are truly identical. Random fluctuations can not be avoided.
Materials with random fluctuations
A simple example is the mixture of concrete. Concrete typically consists of stone, cement and water. In Figure 1 a cut through cured concrete is presented. Depending on the specific mixture concrete behaves differently. This can show itself by curing time or tensile strength. Due to the randomness of the distribution of the rocks in the mixture the exact properties can not be controlled.

Grafik 1: Cut through cured concrete
Ralf Saalmueller, CC ASA 3.0 Unported License, https://creativecommons.org/licenses/by-sa/3.0/deed.en
The same is true for industriell produced structures. In Figure 2 the results of a tensile test of polymer specimens are presented. The axis show the force over the extension of the specimens. Each color represents an individual experiment. The general behavior of all specimens, i.e., the curve progression is very similar. However, the needed force for a given extension can vary greatly. Exemplary, for an extension of 6 mm between 28 N and 45 N are needed. These differences might be explained by differences in the heating during the production.
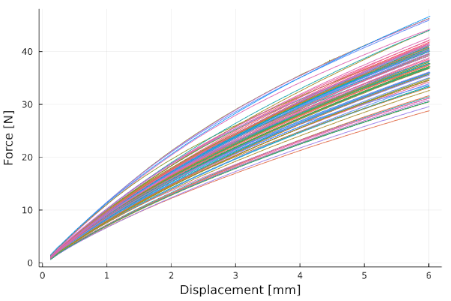
Grafik 2: Force over displacement for polymer specimens
Stochastics
This observation opens the question how these fluctuations can be characterized. For this, the mathematical subfield of stochastics is employed. In stochastics, problems with random results are investigated. A simple example is the throw of a coin. It is impossible to predict the result of a single throw. However, it is possible to make statements over the averaged results of a large number of throws. Typically, one would expect that after a large number of throws both sides of the coins would occur approximately the same amount of time.
For the case of the tension experiments the force is a continuous random variable which can take any positive value in principle. A histogram can be used to visualize the occurrence of the results. For this the data is separated in individual classes. Exemplary, this is shown in Figure 3. With growing number of experiments and smaller class labels the histogram changes to a continuous distribution.
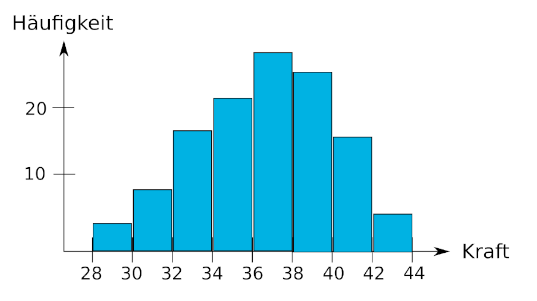
Grafik 3: Histogram for the force for a displacement of 6 mm.
Important variables of the distribution can be determined using the histogram or a distribution function. These include the expected value and the standard deviation. The expected value is the average value that can be expected from many repetitions of the experiment. The expected value is the mathematical mean value. The standard deviation indicates how much the individual results deviate from the expected value. Without random fluctuations, the standard deviation would always be 0. Further variables can be defined to characterize some more complex distributions.
For the design of the components, not only the stochastic properties of the forces are of interest, but also the stochasticity of the stresses in the material and the development of the microstructure.
The aim of the Gen-TSM project is the efficient prediction of these stochastic variables in order to obtain more precise statements about reliability.
Funded by the European Union (ERC, Gen-TSM, project number 101124463). Views and opinions expressed are however those of the author(s) only and do not necessarily reflect those of the European Union or the European Research Council Executive Agency. Neither the European Union nor the granting authority can be held responsible for them.


